After assessing the maturity of the products in the digital portfolio, one of the many things that stood out significantly was the lack of analytics and access to quantitative data. The product teams and stakeholders did not know whether their investments were utilised, there was no valid data proving that the products were adopted.
Through various routes, the final decision and solution to the problem was building the Digital Adoption Platform, named DAP. DAP is now a Power-BI led platform which enables the digital products to ultimately understand and measure the performance and success of their products in the portfolio.
My role
Leading the discovery of adopting third-party adoption platforms for analytics, benchmarking, identifying industry measurements and metrics, introducing into sprints through user stories and A/C and creation of designs.
Team
Tools
Timeline

The discovery started with assessing the current state. The effort to assess product adoption involved a cross-functional team over five days, revealing an initial high adoption rate of 85% on one of the products. However, misunderstandings arose when stakeholders misinterpreted data, equating market potential with actual usage, which suggested a false low of only 3%. This discrepancy highlighted the need for clearer communication and education around digital products and adoption amongst digital stakeholders.
Key challenges identified:
There is no valid data on adoption (usage) of the tools
Product development teams did have access to data about users, which made it difficult to conduct targeted usability testing and other types of research
Misinterpretation of adoption metrics, combining it with market potential (how many projects could actually use the product internally in the business)
IT security restrictions preventing the use of certain analytics tools (e.g., Hotjar, Whatfix, Clarity) due to data sharing concerns
Lack of awareness among product teams about actual product adoption levels, impacting motivation and strategic decision-making
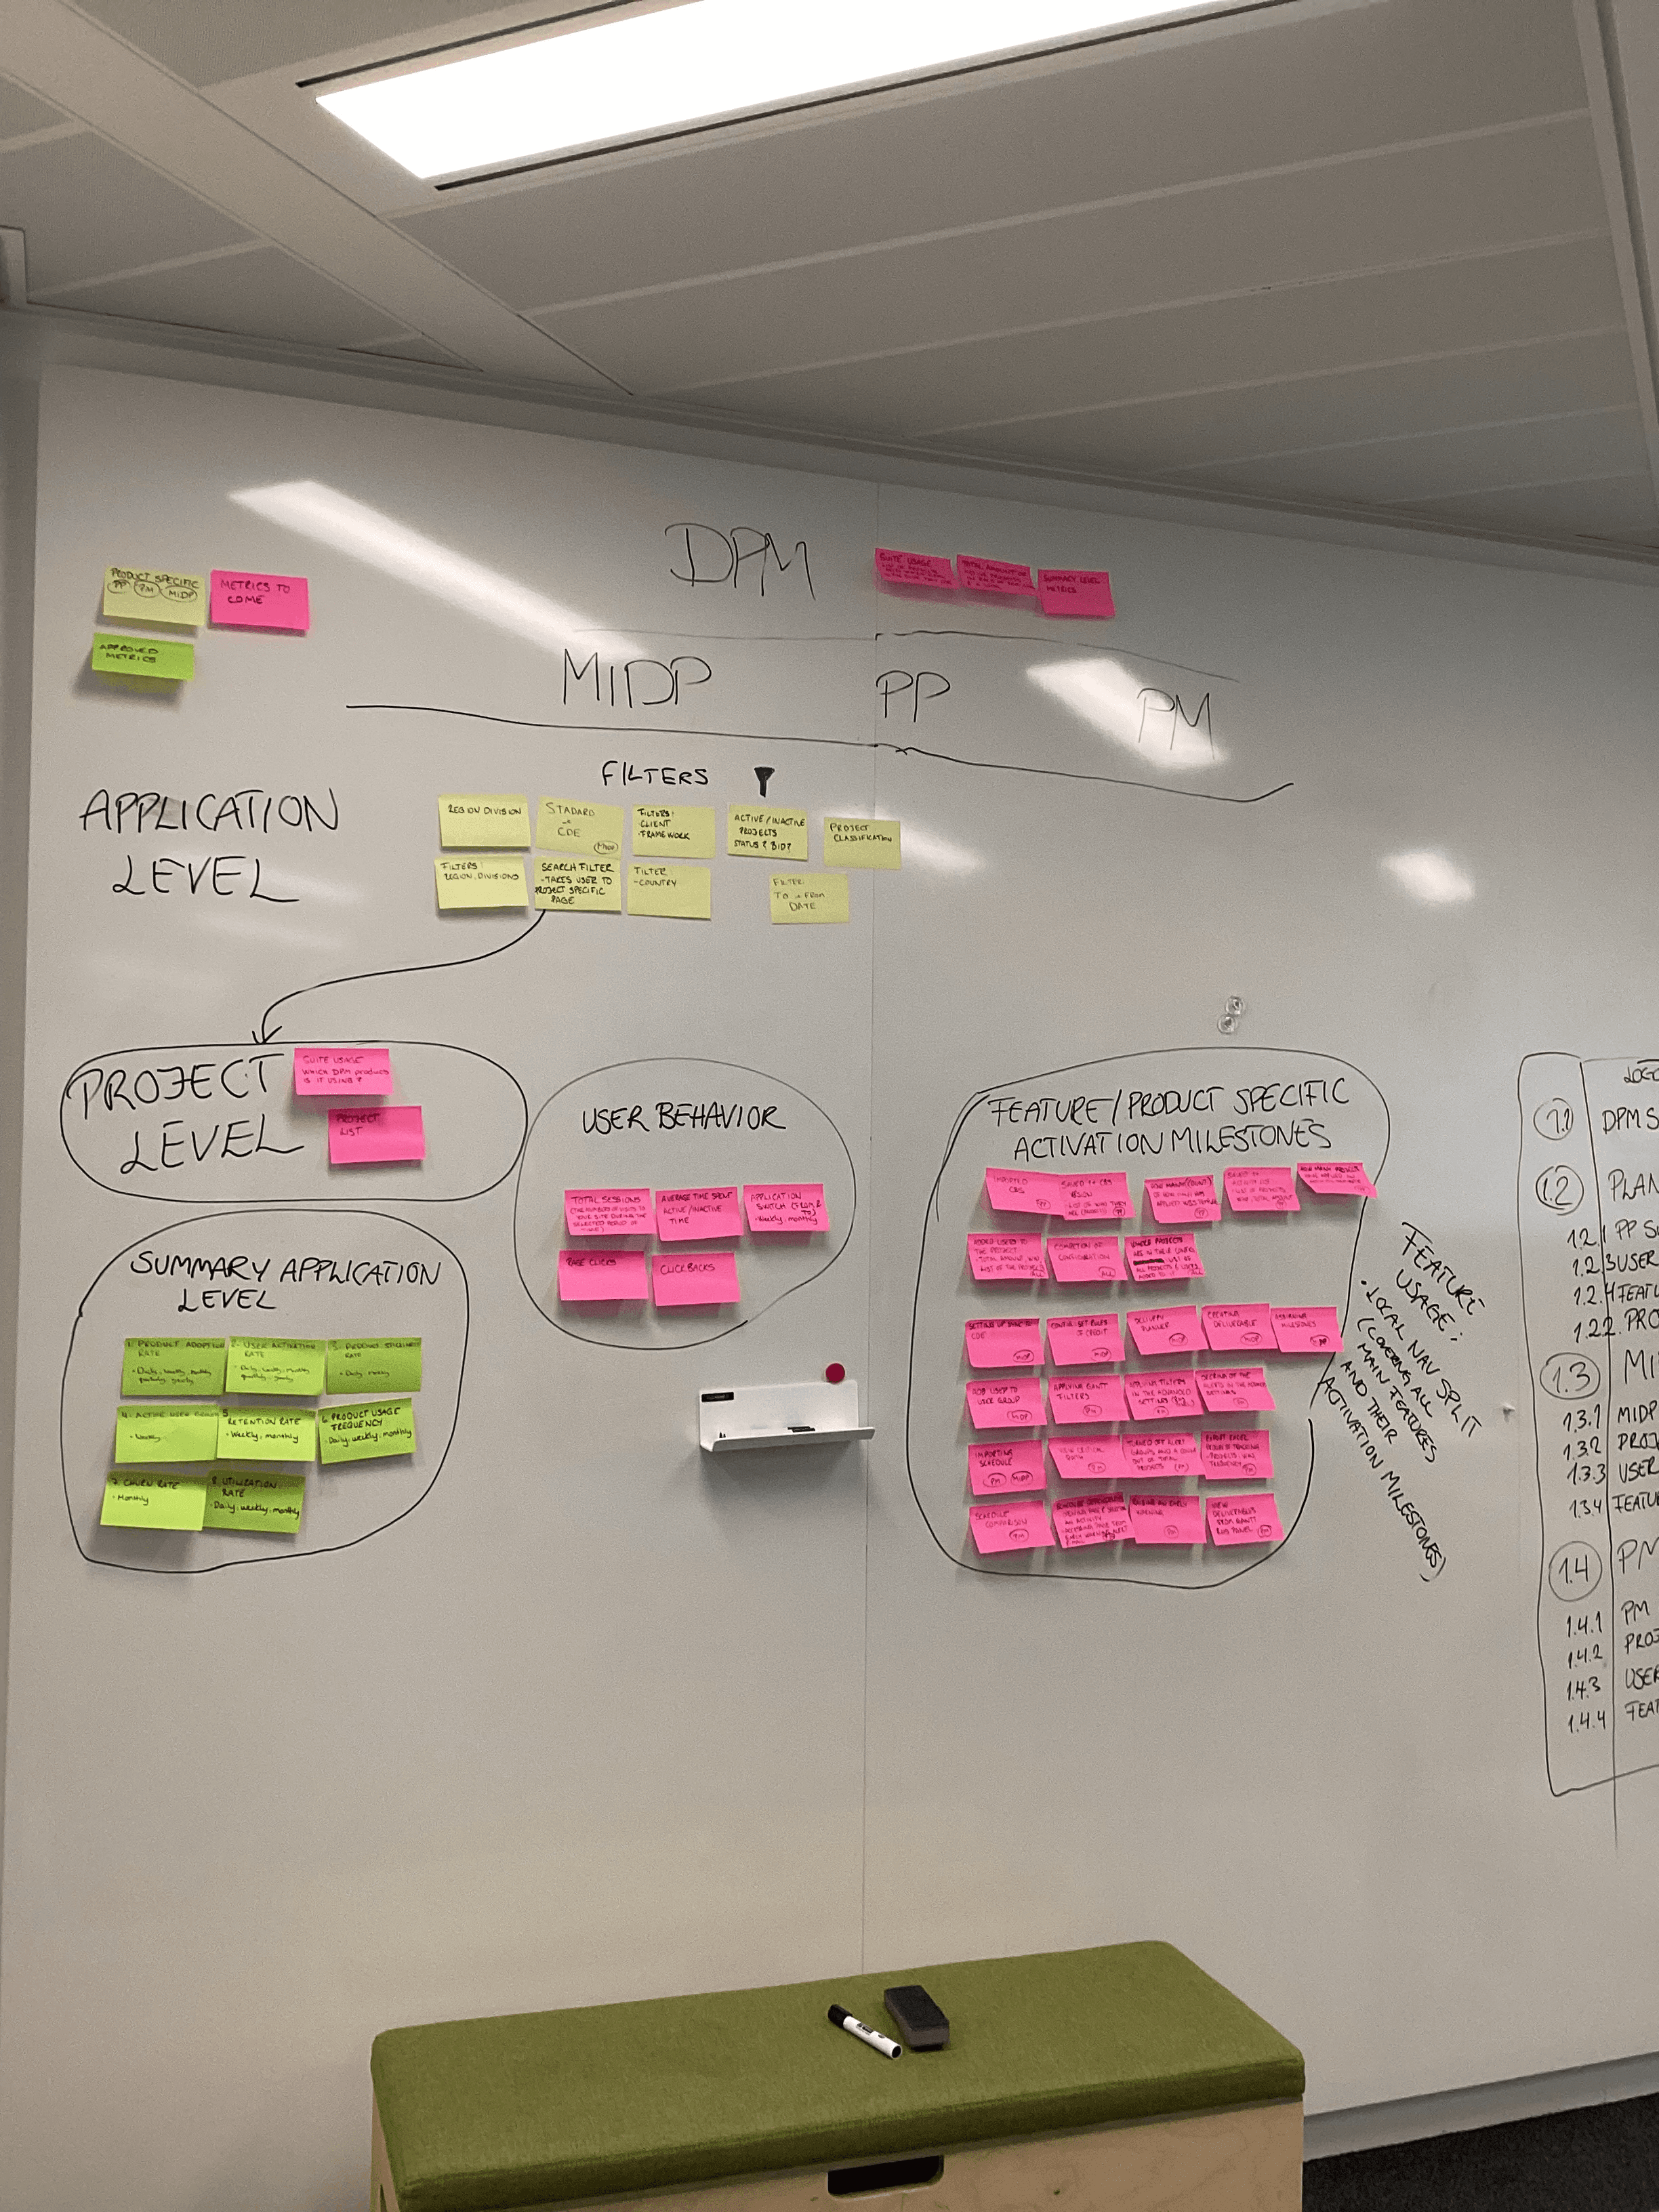
The discovery process also involved mapping industry standards, defining key activation milestones with SMEs, and exploring demo integrations of analytics tools to better understand product engagement—all within legal constraints around data sharing. Since each of the metrics and measurement were dependent on "key activation milestones", these were then through several workshops defined, and brought into the calculations inside the tool to provide accurate measures.
There are 8 separate metrics we are going to measure which are as follows:
Product Adoption Rate
User Activation Rate
Product Stickiness Rate
Active User Growth
Retention Rate
Product Usage Frequency
Churn Rate
Utilization Rate
Activation Milestones and Project refer to whether this metric is also calculated for each activation milestone and for each project.


The creation of the Digital Adoption platform has been a challenging, educational and fun one year long journey from discovery to release. This adoption platform has now empowered the product teams to make data-driven decisions through analytics, streamlining processes, and mitigating reliance on unapproved third-party services.